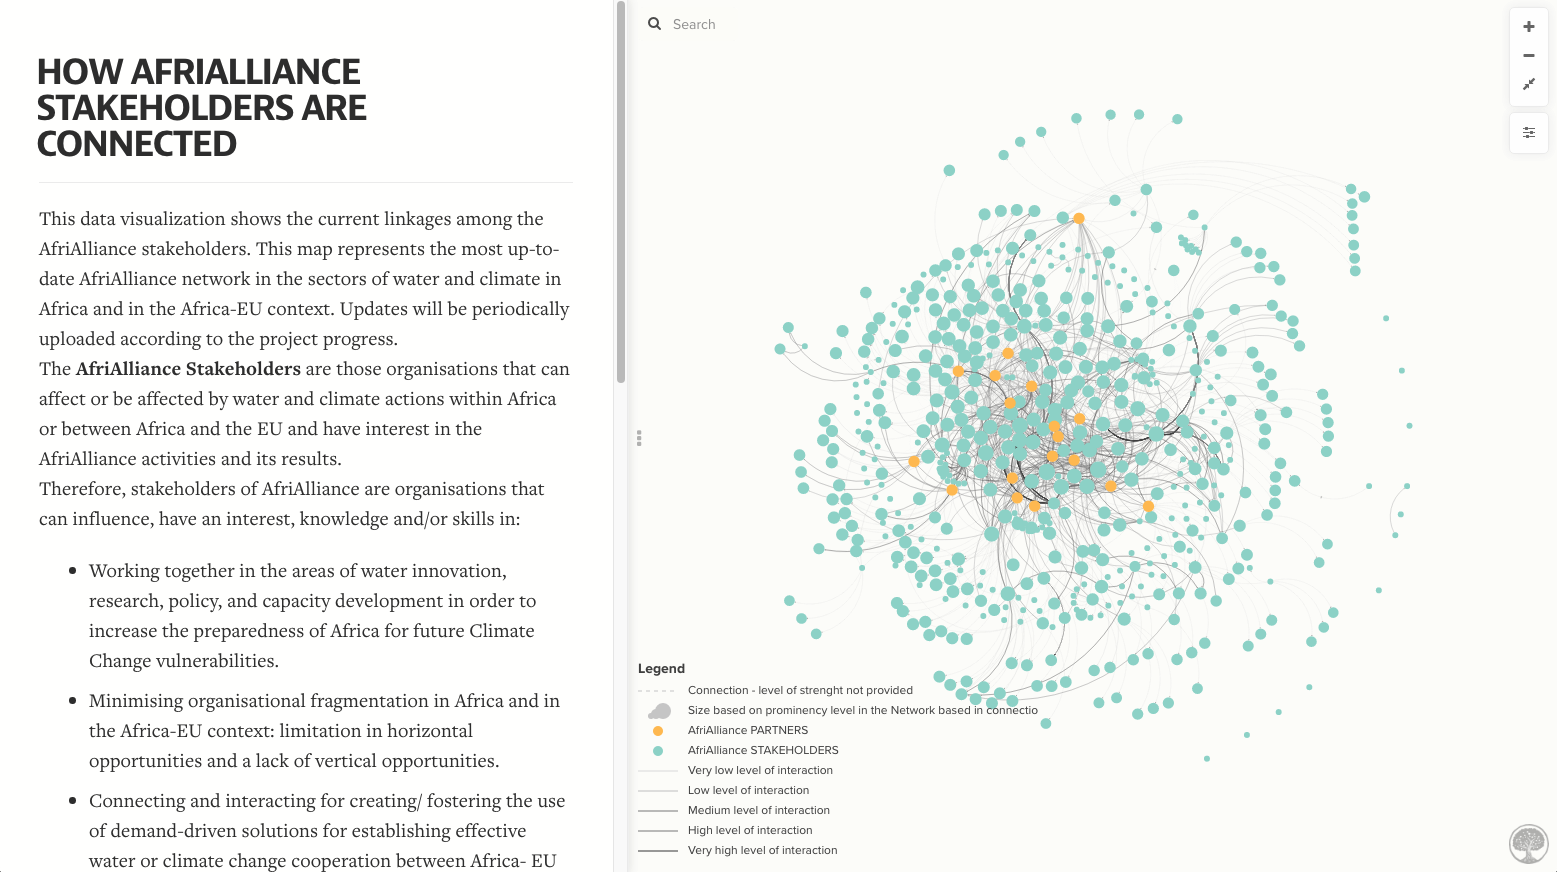
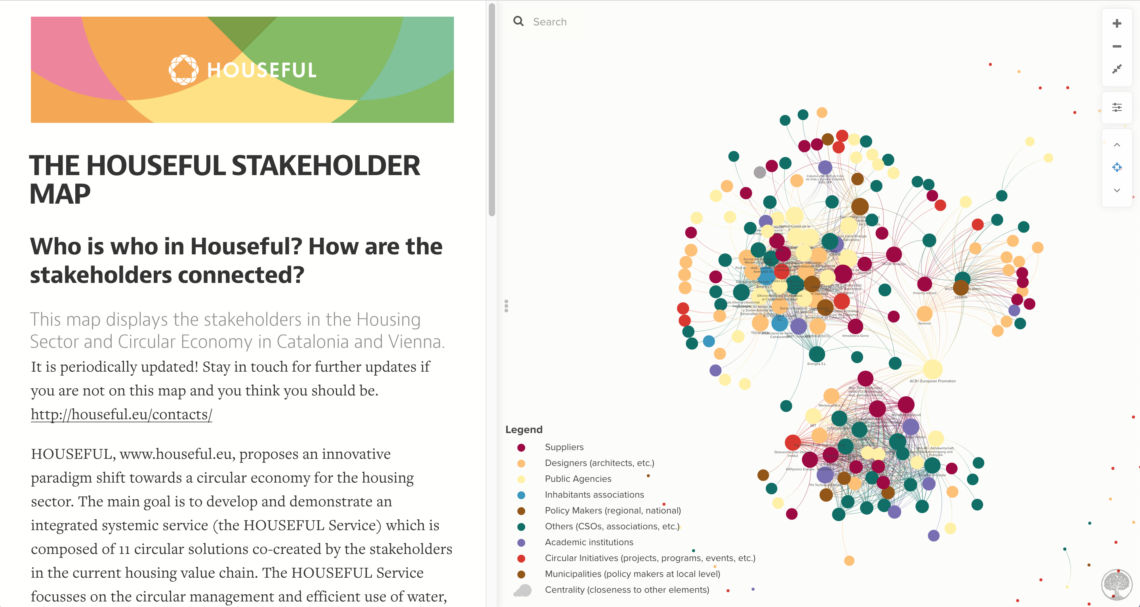
The WE&B Social Network Analysis (SNA) and Insights
The WE&B SNA is a practical, measurable approach to better understand and visualise the collaboration levels, the relationships and/or flow of information within your organization, project or network.
A Packaged Service with benefits
Our insights will thus enable your organization to achieve objectives from attaining growth, generating new acquisition, retaining customers, improving internal or external business relations to improving project organizational processes.
Furthermore, using Social Network Analysis (SNA), WE&B can overlay a stakeholder network map together with fuzzy cognitive mapping (a graphical representation of the knowledge about, or the perception of, a given system). This ability provides a deeper analysis of different systems. For example, we can analyse the interplay, risks and interaction between human and environmental systems.
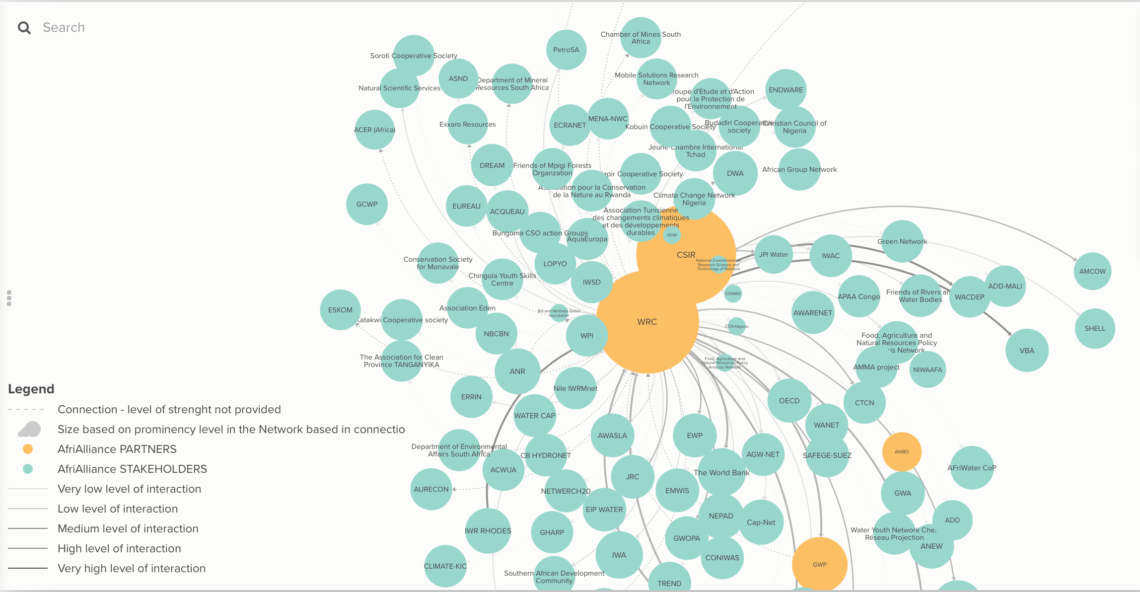
SOCIAL NETWORK ANALYSIS
What do we do?
The WE&B team – with years of Social Network Analysis across various sectors and disciplines – will shine a light on the levels of collaboration between groups, identify the key stakeholders, clarify their roles, determine how and when they should be engaged and provide recommendations to transform them into efficient management systems.
The WE&B SNA Insights Process
We design a bespoke service aligned to your needs
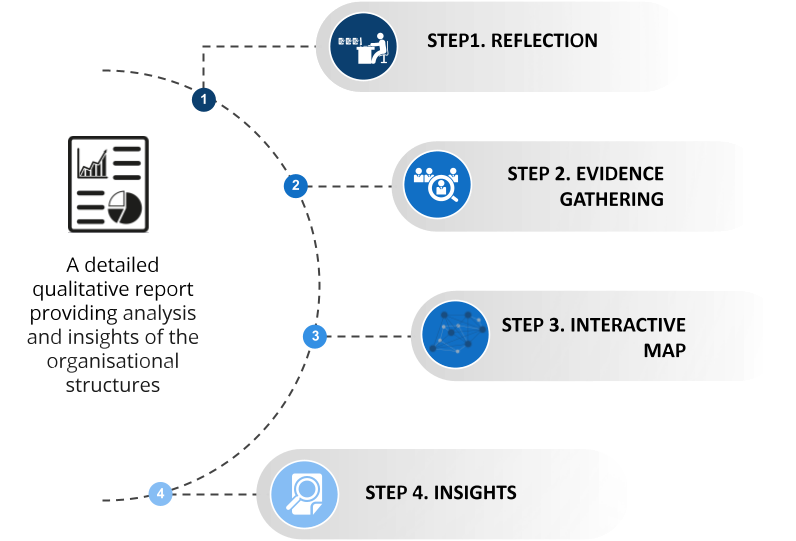
STEP1. REFLECTION
Build up from your existing stakeholder database and rethink it together, to co-create the social structure you want to see.
STEP2. EVIDENCE GATHERING
Gathering evidence following the Social Network Analysis method – a quantitative approach based on a new database creation through an iterative survey and snowballing sampling process.
STEP3. INTERACTIVE MAP
Map visualization – the creation of an interactive map to allow, in a visual manner, to see the key players, influential actors, etc. within your group/project activities/internal and external networks etc.
STEP4. INSIGHTS
Analysing and providing insights into the connections, collaborations and reasons behind the bridges, bottlenecks and the flow of information.
-
Step1. Reflection and report on your current network situation
Build up from your or an existing stakeholder database and/or map and RETHINK it together, to co-create the social structure you want to see
-
Step 2. Stakeholder database based on the Social Structure analysis
Gathering evidence following the Social Network Analysis method – a quantitative approach based on a new database creation through an iterative survey and snowballing sampling process
-
Step 3. Sleek visualization of your Stakeholder map
Map visualization – the creation of an interactive map to allow you in a visual manner to see the key players, influential actors, etc. in your network
-
Step 4. Map Updates
Updating of your current stakeholder map
-
Step 5.Social Qualitative Analysis
Stakeholder Map Reflection - using social qualitative techniques to deepen into your social structure and interpretation
Projects
SNA Success Stories
SCIENTIFIC BACKUP
Papers
- Wasserman, S., and Faust, K. (1994). Social Network Analysis : Methods and Applications. Cambridge: Cambridge University Press. doi: https://doi.org/10.1017/CBO9780511815478
- Prell, C., Hubacek, K., & Reed, M. (2009). Stakeholder analysis and social network analysis in natural resource management. Society and Natural Resources, 22(6), 501–518. https://doi.org/10.1080/
08941920802199202
- Scott, J. (2017). Social network analysis. 4th ed. London, UK: Sage. Available online at: https://uk.sagepub.com/en-gb/
eur/social-network-analysis/ book249668
Interested?
Request a quote
In order to create an accurate quote for your needs, please answer the following
questions and we will get back to you within 24hrs with a quote.
